Our Research
Pioneering new paths for cancer prevention – earlier tumour detection and improved outcomes.
Our Research
Pioneering new paths for cancer prevention – earlier tumour detection and improved outcomes.
Cell size and growth regulation – how do cells measure themselves?
Regulation of cell size is crucial for many important physiological processes and diseases. For example, cell size changes occur during differentiation, and abnormalities in cell size are often found in cancer tumours. In healthy tissues, cells of the same type are usually very similar in size. This uniformity suggests that there is a regulatory mechanism that sets a specific target size for all cells in a tissue. The question is: what are the mechanisms behind this regulation, and why does it go wrong in tumours that show varying cell sizes, like pleomorphic tumours?
To answer these questions, we combine single-cell microscopy with genetic and pharmacological techniques to measure and manipulate cell size. We also use various mathematical methods to break down and understand the effects of different factors on cell size, such as growth factors and the cell cycle stage.
Our lab is studying an important question: how are growth pathways like mTORC1 and c-Myc controlled to ensure cells grow to the right size? For example, in human pancreatic acinar cells, growth processes produce cells that are about 1300 μm³, while beta cells in the same tissue are only about 600 μm³.
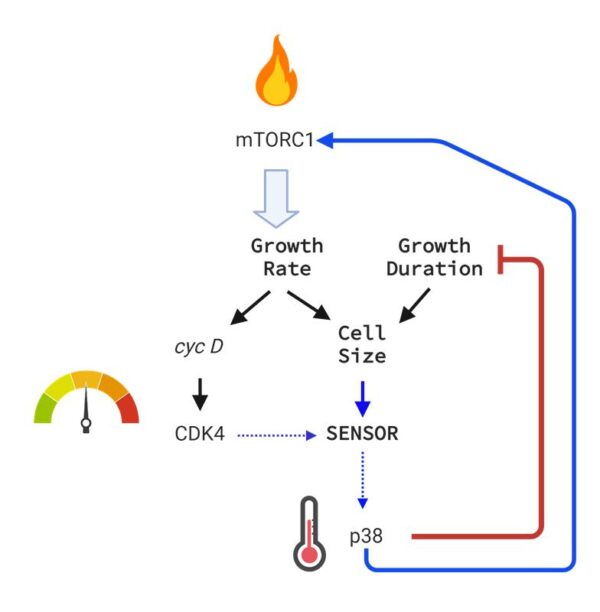
While we know how specific signaling pathways influence growth, the bigger question is: how do these signals achieve precise cell sizes and proportions? While external signals can determine the average cell size in a tissue, maintaining uniformity among cells requires a cell-intrinsic size-correcting mechanism. Similar to how a thermostat regulates room temperature, we suggest that a biochemical circuit including CDK4 sets and adjusts the target size for cells. The p38 pathway is then selectively activated to promote growth in cells below this target size, while cells above the target size have increased protein degradation.

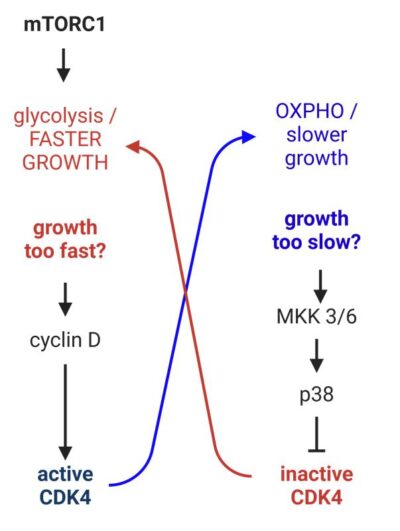
Just like a thermostat keeps the room temperature steady, our findings show that slow cellular growth (low mTORC1) activates p38, which then inhibits CDK4. As a result, the inhibition of CDK4 increases mTORC1 activity, helping to restore faster growth rates.

High cellular growth rates (due to high mTORC1 activity) lead to increased levels of cyclin D, which boosts CDK4 activity. In turn, higher CDK4 activity then slows down the growth process by inhibiting mTORC1.
Longevity and aging – the surprising connection to cell size
Our research has revealed a strong connection between cell size and lifespan. Through collaborations with the Toronto Zoo and other institutions, we discovered that smaller cells and slower growth rates are linked to longer lifespans across various mammal species. For example, animals like mice, which have larger cells, tend to have shorter lifespans compared to species with smaller cells, such as fruit bats, which can live up to 40 years.
This connection between cell size and longevity is related to how cell growth is regulated. Mechanisms like mTORC1, which promote cell growth, also speed up aging. However, inhibiting mTORC1 not only slows down cell growth but also extends lifespan and helps delay age-related diseases like cancer. We are currently studying how mTORC1 and other pathways control these processes to better understand lifespan at both the cellular and organismal levels.

Correlation between cell size and longevity in mammals.

We found that short lived mammals have cells that are larger and more biosynthetic. From our studies on cell size, we discovered that larger and more biosynthetic cells are promoted by inhibited CDK4. From literature, we know that p16, a CDK4 inhibitor, promotes faster aging and shorter lifespans.

Average acinar cell volume derived from more than 25 different mammals negatively correlates with maximal species lifespan in captivity. Image demonstrates a discernible difference in cell size among species that span a wide range in lifespan.
Cellular individuality in human cancers
In healthy epithelial tissues, individual cells appear regular and uniform. In contrast, cells in malignant populations vary greatly in size, shape, and response to drugs. This variability in cell size is especially noticeable in pleomorphic tumors, a type of cancer characterized by increased differences in cell appearance from one to another. However, the underlying causes of this increased variability in pleomorphic tumors are not yet understood, nor is it clear why this variability is linked to more aggressive disease. To investigate this, we developed a model of pleomorphic breast cancer tumors using xenografts in mice. We combine single-cell imaging and detailed analysis of cultured cells in the lab with measurements taken from the tumors.
Over the past few years, the Kafri Lab has developed a specialized pipeline of software for image analysis to tackle research questions by quantifying the behavior of single cells. Using this pipeline, we can measure multiple proteins in individual cells cultured in vitro, track changes in protein expression over time, and analyze signaling in tissue sections at single-cell resolution. Recently, we have expanded our toolkit to include the identification of morphological features. One key advantage of this image processing code is that it is created in-house, making it flexible and adaptable to meet changing research needs and conditions.
The Kafri Lab has been refining in-house software to automatically classify fibroblasts based on distinct, computationally defined morphologies. This is important because morphological differences can not only distinguish between cancerous and non-cancerous cells but also provide insights into various aspects of cell function. For instance, the epithelial-to-mesenchymal transition (EMT) is associated with specific changes in cell shape (Moreno-Bueno, G. et al., 2009). Similarly, distinct morphological features can differentiate senescent cells from non-senescent ones (Sikora, E. et al., 2016), or distinguish differentiated cells from cancer cells that have become dedifferentiated. In practice, we will “ask the computer” to analyze hundreds of thousands of images of single cells, sorting them into groups based on their morphological similarities.
Inference in systems pharmacology
Drugs are typically discovered by screening compounds to see how they affect targets believed to drive disease. Traditional screening assays often rely on bulk measurements, which are averages taken from a population of cells exposed to the drug. This approach assumes that all individual cells respond to the compound in roughly the same way. However, this assumption doesn’t reflect the complexity of biological systems. In reality, cells can respond very differently to the same compound. To address this, we are developing mathematical methods that take advantage of single-cell variability to gain deeper insights into the signaling pathways that control reporter targets.
Over the past decade, significant pharmaceutical efforts have focused on screening for compounds, such as Imatinib (Gleevec), that specifically target the single oncogene or protein responsible for a particular disease. While this approach has led to some successes, its results have been less promising than initially expected. One challenge is that certain proteins, like oncogenic Ras, have proven difficult to effectively inhibit. Even when potent inhibitors are discovered, therapeutic success is often limited. This is partly because current strategies target a single oncogene without considering the broader network of signaling pathways in which it operates. For example, inhibiting oncogenic BRAF with the drug vemurafenib can relieve BRAF’s feedback inhibition of HER2, which ultimately leads to drug resistance and reduces the therapy’s effectiveness. As a result, there is growing urgency to identify compounds that target the broader “communication channels” involved in pathogenic processes, rather than focusing on just one specific target.
In 2013, we published a letter in Nature introducing ergodic rate analysis (ERA), a method that allows for a detailed understanding of the intracellular dynamics of a labeled protein or phospho-protein using just a single snapshot image of fixed cells. The innovation of ERA lies in its ability to capture the temporal profile (or dynamics) of a labeled target without the need for expensive time-course or time-lapse measurements. While the mathematical specifics of ERA are complex, the basic idea is straightforward: faster (more transient) molecular events are observed in fewer cells within an imaged population. This principle also helps uncover additional insights into the regulation of a labeled reporter target. For example, feedback inhibition of phospho-Akt (pAkt) would be revealed by observing “fewer than expected” cells with high pAkt levels in the population. This explanation is a simplified version of a much more rigorously developed mathematical approach.
In recent years, we have been developing mathematical inference methods to predict how a compound affects the regulation of a reporter target using high-throughput single-cell microscopy data. We believe these statistical methods will not only lower the costs of drug discovery but also enable the screening of features that were previously difficult or impossible to assess.


